
|
OpenRPT Product Guide |
|
|
OpenRPT Product Guide |
| 6.2. Graphical Report Definition | ||
|---|---|---|
 | 6. Graphing |  |
The nature of a report definition that displays information graphically is fundamentally the same as one that displays information textually. Indeed, a report definition that displays numerical information is often a good candidate for graphical enhancement.
Below we see the report definition for the Time Phased Usage Statistics By Item screen after the section Report Header has been enlarged and a graph object has been added to it:
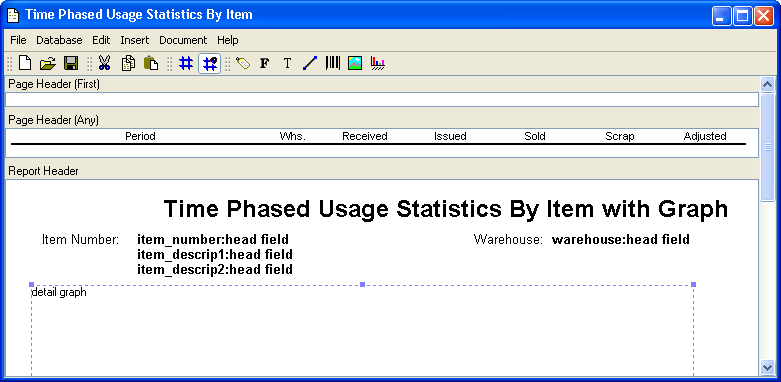
A graph object is added using the graphing tool on the toolbar. Start by clicking on the graphing tool. Then, click on the area in the section of the report definition where you want the graph to display. Next, resize the resulting graph object box with your mouse. Finally, double-click on the graph object to define detailed information about its behavior.
We will cover graphing object definition shortly. First, let's take a look at the SELECT clause in the report's query definition to see the origin of the column values that will be used to define values and information for the X and Y axes.
| |  | |
| 6.1. Graphical Report Output |  | 6.2.1. Query Source |