
|
xTuple ERP Reference Guide |
|
|
xTuple ERP Reference Guide |
| 4. View Database Log | ||
|---|---|---|
 | Chapter 9. System Module |  |
The Database Log viewer is designed to simplify the process of troubleshooting errors when and if they occur. If you experience an unexplained error when using the system, open the database log and view the messages written there. This information will help system administrators—or your support provider—to analyze and determine the root cause of the problem.
Software developers who are writing packages for xTuple will also find this functionality is useful to them. In addition to capturing qCritical and qFatal messages, the Database Log viewer can also be enabled to show qDebug and qWarning messages. These qDebug and qWarning messages do not cause the error icon to appear (like qCritical and qFatal messages do); however, developers can simply keep the Database Log viewer open to see the lower level messaging as it appears.
If you are running into database errors which are not being reported on in the Database Log viewer, it's possible you may need to check your PostgreSQL logs for more information—and to troubleshoot further.
To view the database log, go to . The following screen will appear:
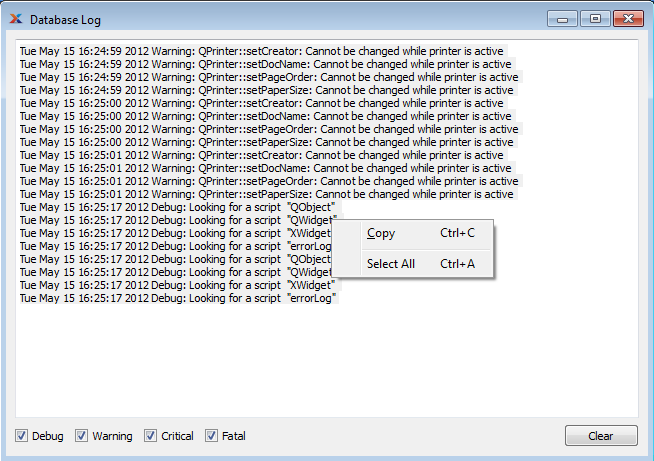
While the information written to the database log may seem cryptic to the average user, the contents written there are invaluable to support technicians and software developers as they attempt to discover the root cause of a problem.
Include the contents of the log file when reporting problems to your support provider. To copy the contents, highlight the portion you want to copy, then select the option from the right-click menu. Finally, paste the copied text into an email or other form of communication (i.e, issue tracking system).
At the bottom of the screen, the following options are available:
Select to include script debugging information in the log output. If not selected, script debugging information will not be shown.
Select to include warning message information in the log output. If not selected, warning message information will not be shown.
Select to include critical error information in the log output. If not selected, critical error information will not be shown. When critical errors occur, the error icon will appear in the lower left-hand corner of the main desktop to notify you.
Select to include fatal error information in the log output. If not selected, fatal error information will not be shown. When fatal errors occur, the error icon will appear in the lower left-hand corner of the main desktop to notify you.
Select to clear the contents of the screen. This option will help you narrow down the cause of an error when troubleshooting problems. After the screen has been cleared, it will continue to show errors the next time an error is encountered.
| |  | |
| 3.1. Scheduled Job |  | 5. User Account Preferences |