
|
xTuple ERP Reference Guide |
|
|
xTuple ERP Reference Guide |
| 13.1.9. Datasources | ||
|---|---|---|
 | 13.1. Configure |  |
All dashboards get their source data and formatting from datasources. Datasources are required to provide the information to populate the charts, but they are also used to define axis labels, color requirements and other presentation aspects of the charts.
To view the list of available datasources, go to and select the tab. The following screen will appear:
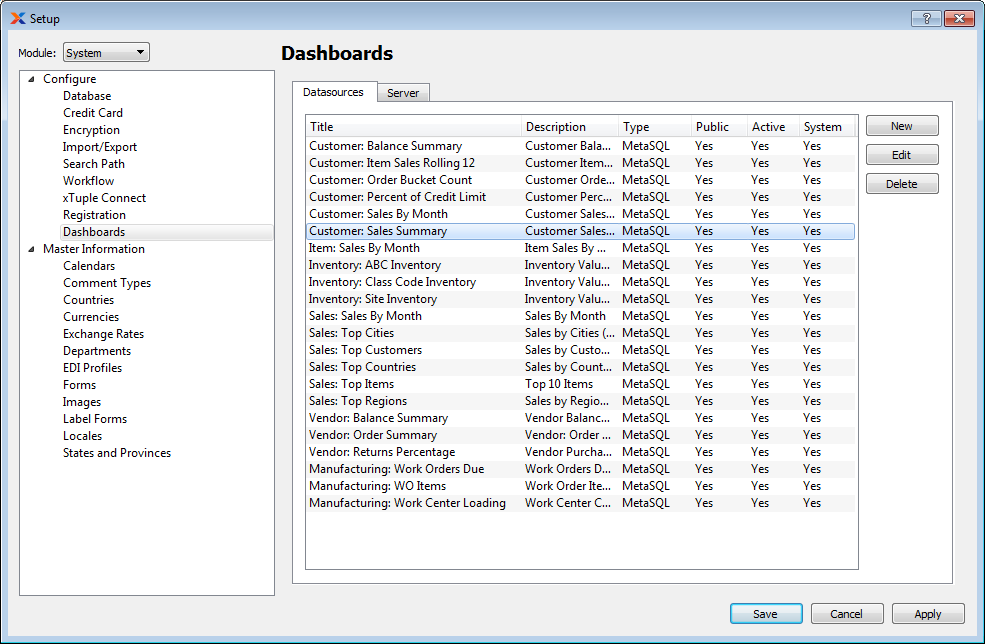
The datasources list displays information on all existing datasources, including datasource title, description, type, and public, active and system statuses.
Many of the dashboards are marked as system dashboards. You should be careful not to edit these, copying their information to your own versions instead.
To view the server side settings for your datasources, select the tab. The following screen will appear:

Server settings define the internal web server that is used to present the dashboard charts. It is technically feasible to use these settings to view dashboards in an external browser or other software. However, if you only intend to view dashboards inside your xTuple client, you can just leave the settings as they are.
When defining your dashboard server settings, you are presented with the following options:
This is the network address of the web server. This is typically 127.0.0.1 for an internal (local) address—or you could enter the IP address of the PC/server running the xTuple client.
Defaults to 3000. Typically no change is required, unless there is a conflict with other software.
Defaults to 3030. Typically no change is required, unless there is a conflict with other software.
Randomly generated key. This does not require changing.
Use the default key unless you wish to make the dashboards externally available and want to provide a suitably secure SSL key.
Use the default key unless you wish to make the dashboards externally available and want to provide a suitably secure (and signed) server certificate.
To create new a datasource, select the button. The following screen will appear:
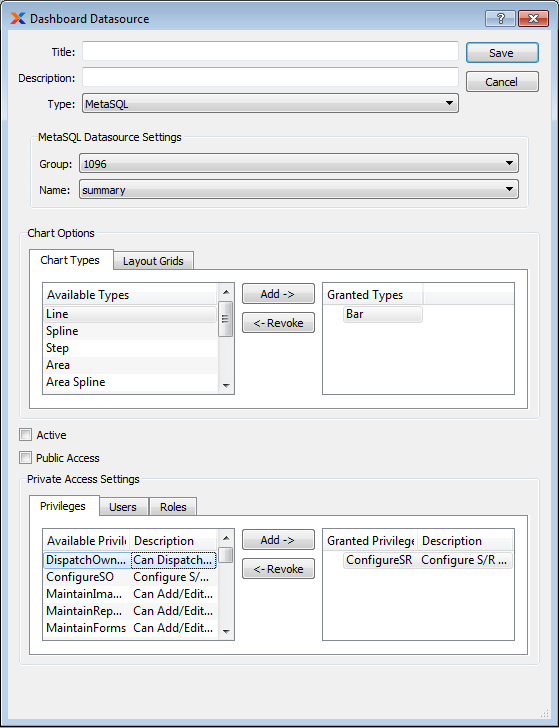
When creating a new datasource, you are presented with the following options:
Enter a title to identify the datasource.
Enter a brief description to describe the datasource.
The type indicates how the datasource will retrieve the data used to populate the charts. The following choices are available: MetaSQL, query item, or URL. Depending on which type you choose, the related on-screen options will change, as follows:
In most cases, datasources will be generated from previously written MetaSQL queries. This is the most common type. Choose the group and name of an existing MetaSQL query to define that as the source.
Query sets are defined in the import/export area of xTuple. To use one of these query sets as a datasource, choose the head name and item.
The URL datasource will allow the datasource data and formatting to be downloaded from an external web source/service. This will allow information external to xTuple to be included in dashboards. This feature has not been implemented yet.
Specify the chart display options you want to make available when dashboard panes are created using the datasource.
Data can be displayed in a number of different graphical formats. The following options are available: bar, line, spline, step, area, area spline, area step, scatter, pie, donut, and gauge. To make a chart type available for the datasource, simply add the chart type(s) to the Granted Types column.
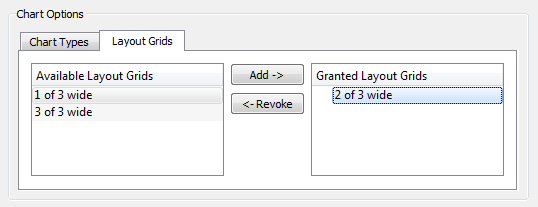
Dashboard panes can be created to display in varying widths per row. Each dashboard row can contain either one, two, or three panes across, depending on the options allowed by the datasource. To specify the grid layout options available for the datasource, simply add the layout grid(s) to the Granted Layout Grids column, as shown in the following screenshot:
Select to indicate the datasource is active. If not selected, the datasource will be considered inactive.
Select to indicate the datasource should be available to all users. If not selected, the datasource will be considered private and will require users to have the appropriate privileges to access it.
If the datasource is private (i.e., not public), then you will need to specify how users will gain access to the information.
Control access using system privileges. Any users having the specified privilege(s) will be able to use the datasource when adding dashboard panes. To specify the desired system privileges, simply add the privilege(s) to the Granted Privileges column.
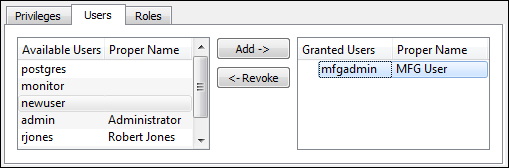
Control access by user. Any user who has been granted access will have access to the datasource. To give access to users, simply add the user(s) to the Granted Users column, as shown in the following screenshot:
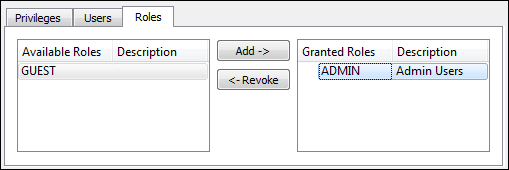
Control access by role. Any users assigned to the specified role(s) will have access to the datasource. To grant access by role, simply add the role(s) to the Granted Roles column, as shown in the following screenshot:
The following buttons are unique to this screen:
Highlight a specific source in the Available Sources column, then select this button to transfer the source to the Granted Sources column. Double-clicking on an available source will also transfer it to the Granted Sources column.
Highlight a specific source in the Granted Sources column, then select this button to remove the source from the Granted Sources column. Double-clicking on a granted source will also remove it from the Granted Sources column.
| |  | |
| 13.1.8. Registration |  | 13.2. Master Information |