
|
OpenRPT Product Guide |
|
|
OpenRPT Product Guide |
| 3.15. Graph Editor | ||
|---|---|---|
 | 3. The Toolbar |  |

'Insert Graph' Icon
The icon enables you to create new graph objects. Graph objects are used to insert graphs into a report definition using dynamic data stored in a database the report writer is connected to.
To create a new graph object, first select the icon. Then click in the section of the report definition where you want the graph to be located. Doing so will create the graph object in that section.
For more information on using graph objects in report definitions, see the Advanced Topics chapter.
Once the graph object has been created, you may then edit the graph object's properties. To edit a graph object's properties, double-click on the graph object. The following screen will appear:

When editing the general properties of a graph object, you are presented with the following options:
Select a query source from the drop-down menu by clicking on the arrow to the right of the field. Query sources are used to populate report definition objects with dynamic data from the database the report writer is connected to.
For more information on query sources and the link between database fields and report definition objects, please see the Getting Started chapter.
Specify how you want the image object to be positioned and sized within the section where it is located.
Specify the distance, measured in inches, from the section’s left border to the upper-left-hand corner of the image object.
Specify the width of the image object, measured in inches.
Specify the distance, measured in inches, from the section’s top border to the upper-left-hand corner of the image object.
Specify the height of the image object, measured in inches.
The position and size of a graphic object may be modified manually when editing a report definition.
Select the base font to be used in the graph object by clicking on the button located to the right of the field. Selecting the button will bring up the Select Font screen, where you may specify font name, font style, font size, and font effects. The base font may be used throughout the graph object.
Specify the following details for the graph object's title:
Enter the title you want to appear centered at the top of the graph.
Select to use the specified base font. If not selected, the title font will be used.
Specify the font to be used for the graph object's title by clicking on the button located to the right of the field. Selecting the button will bring up the Select Font screen, where you may specify font name, font style, font size, and font effects.
At the bottom of the screen, the following buttons are available:
Select to save your settings.
Closes the screen without saving any changes, returning you to the application desktop.
To define the properties of the graph object's data axis—that is, the horizontal axis running along the bottom of the Graph—select the tab at the top of the Graph Editor screen. The following screen will appear:
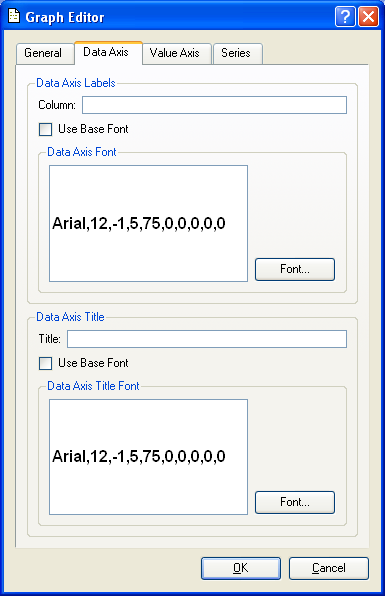
When editing the data axis properties of a graph object, you are presented with the following options:
Specify the following details for the data axis labels:
Specify the name of the database column you want to use from the selected query source. A query source may refer to multiple columns in its SELECT statement. By indicating a specific column, you instruct the query source to return data only for that specified column. Other columns appearing in the SELECT statement will be ignored.
The term data axis labels refers to the identifying information which describes each of the items in a graph’s series. For example, if a graph displays information about a series of item numbers, then data axis labels would be used to identify each of the items in the series.
Select to use the specified base font. If not selected, the data axis font will be used.
Specify the font to be used for the data axis labels by clicking on the button located to the right of the field. Selecting the button will bring up the Select Font screen, where you may specify font name, font style, font size, and font effects.
Specify the following details for the data axis title:
Enter the title you want to appear centered along the bottom of the graph’s data axis.
Select to use the specified base font. If not selected, the data axis title font will be used.
Specify the font to be used for the data axis title by clicking on the button located to the right of the field. Selecting the button will bring up the Select Font screen, where you may specify font name, font style, font size, and font effects.
At the bottom of the screen, the following buttons are available:
Select to save your settings.
Closes the screen without saving any changes, returning you to the Application desktop.
To define the properties of the graph object's value axis—that is, the vertical axis running along the left-hand side of the graph—select the tab at the top of the Graph Editor screen. The following screen will appear:
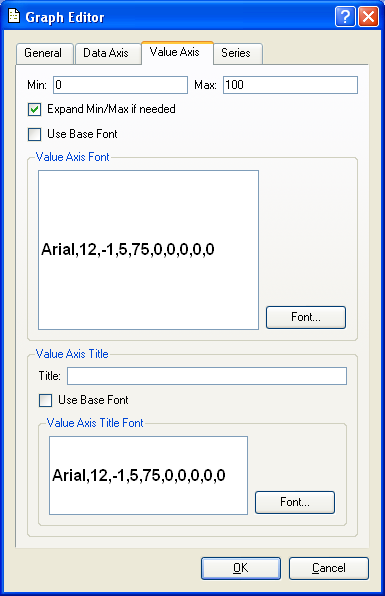
When editing the value axis properties of a graph object, you are presented with the following options:
Specify the minimum value you want to have appear on the graph object's value axis.
Specify the maximum value you want to have appear on the graph object's value axis.
Select to allow data represented in the graph to expand beyond the minimum and maximum values specified if needed. If not selected, data will be restricted to the limits specified for the minimum and maximum values.
Select to use the specified base font. If not selected, the value axis font will be used.
Specify the font to be used for values in the value axis by clicking on the button located to the right of the field. Selecting the button will bring up the Select Font screen, where you may specify font name, font style, font size, and font effects.
Specify the following details for the value axis title:
Enter the title you want to appear centered along the left-hand margin of the graph’s value axis.
Select to use the specified base font. If not selected, the value axis title font will be used.
Specify the font to be used for the value axis title by clicking on the button located to the right of the field. Selecting the button will bring up the Select Font screen, where you may specify font name, font style, font size, and font effects.
At the bottom of the screen, the following buttons are available:
Select to save your settings.
Closes the screen without saving any changes, returning you to the application desktop.
To define the properties of graph object series, select the tab at the top of the Graph Editor screen. The following screen will appear:

When editing the properties of a graph object series, you are presented with the following options:
Select a series from the drop-down menu by clicking on the arrow to the right of the field. Each graph must contain at least one series—and may contain multiple series. Using multiple series enables you to compare and contrast information from different database columns within a single graph. To create a new series, select the button. By default, a new series will be given the name "New Series." You may edit this default name within the Name field below. To remove a series from the list of series, select the button.
You may assign different properties to each series in a graph (e.g., different colors) to make a clear visual distinction between series.
Specify properties for the selected series using the following options:
Displays the name of the series. You may edit the name of the series using this field. Any editing changes will be saved automatically.
Specify the name of the database column you want to use from the selected query source. A query source may refer to multiple columns in its SELECT statement. By indicating a specific column, you instruct the query source to return data only for that specified column. Other columns appearing in the SELECT statement will be ignored.
Specify the color you want to use to represent data in the series. Selecting the button will bring up several color definition screens. You have the ability to specify multiple colors, using either the included color wheel or standard RGB values.
Specify one of the following options to be used for representing items in the series: Bars, Lines, or Points.
At the bottom of the screen, the following buttons are available:
Select to save your settings.
Closes the screen without saving any changes, returning you to the Application desktop.
| |  | |
| 3.14. Images |  | 4. Managing Report Definitions |