
|
xTuple for Service Businesses Demo Guide |
|
|
xTuple for Service Businesses Demo Guide |
| 5. Capacity Buffer Scenario | ||
|---|---|---|
 | Chapter 4. Constraint Management |  |
Finally, let's examine a capacity buffer scenario. The work order we created in the previous section enabled us to get familiar with the concept of time buffers. Well, in addition to time factors, we must also consider the impact—or load—that a work order places on work centers. In the case of production for the YTRUCK1 item, three work centers will be affected.
Nearly all manufacturers have one bottleneck work center that constrains their entire operation. It is the load on this work center that warrants close monitoring. The Capacity Buffer screen enables us to view the current load in relation to a definable number of days of capacity. To view the capacity buffer status for our current Work Centers, follow these steps:
Pull down the module menu
Select the submenu
Choose the Capacity Buffer Status option
Set the following: All Work Centers = checked; All Sites = checked; Max Days Load = "5".
Click the button
The following screen will appear:
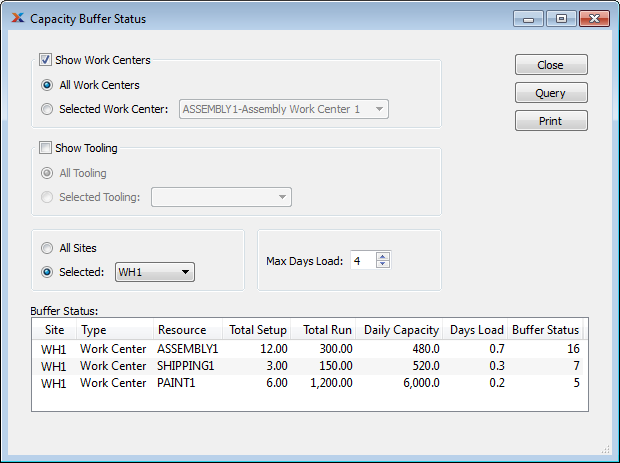
The first two columns after the work center names show the current load on each work center order that pass through each, regardless of their scheduled dates. The fifth column shows the daily capacity of each work center, as defined in the master information for each work center's definition. The Days Load column shows the sum of total setup and total run (total load in minutes) divided by a work center's daily capacity. The final Buffer Status column takes into account the value you set in the Max Days Load field before you clicked the button.
Here is another example to illustrate how the capacity buffer is calculated. Suppose that the daily capacity of the stamping work center is 480 minutes, and we set the display with a Max Days Load = "5". The numerator in our calculation would be 5 * 480 = 2400 minutes. If the total setup for all work orders going through stamping is 60 minutes and the total run time is 2000 minutes, the numerator will be 2060 minutes. The buffer status would then be 2060 / 2400, or 85%. This tells us that we have loaded the stamping operation with 85% of the capacity available over a five-day period of time. We would see the value 85 displayed in the Buffer Status column.
The capacity buffer is the relative load of a resource compared to the desired lead time of items coming out of that resource. For example, suppose we have a shop with a typical lead time of two weeks that has a milling department heavily loaded. Perhaps we have identified milling as our shop's bottleneck and will use the constraint management system to monitor it. The capacity buffer would be two-weeks worth of load, meaning that the milling department can be loaded with up to two-weeks worth of work before it is considered fully-consumed. The capacity buffer size is entered as Max Days Load by the user when they run the report. When the Buffer column in the display for milling equals 100 we know it is fully consumed.
The capacity buffer is an excellent tool for monitoring your shop's bottleneck work center(s). Using the system, you can help ensure that the shop as a whole is able to achieve complete work orders, and, ultimately, deliver orders successfully to your customers within the stated lead times.
| |  | |
| 4. Time Buffer Scenario |  | 6. Other Constraint Management Displays |