The report renderer generates printed reports from report definitions. Like the report writer, the report renderer is a multi-platform tool which is available as either a standalone application or an embedded version bundled with xTuple. The report renderer is designed to connect to PostgreSQL databases; however, the application’s source code could be modified to enable connections to other databases, as well.
Tip
The standalone report renderer can be used by xTuple users to generate custom reports—that is, reports which are not available using the xTuple menu structure. This flexibility enables users to extend the reporting capabilities of xTuple.
In this section, we will focus on the standalone report renderer. The standalone version gives users the ability to connect to multiple databases—and generate custom reports from those databases.
To open the report renderer, locate the renderer application file on your system. It should be installed in a directory along with its required support libraries. These support libraries will vary depending on your operating system. Once you have opened the file, you will be presented with the initial log in screen, as shown in the following screenshot:
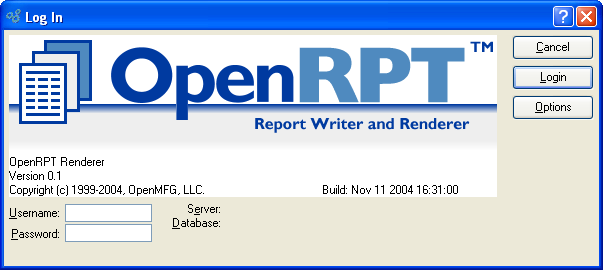
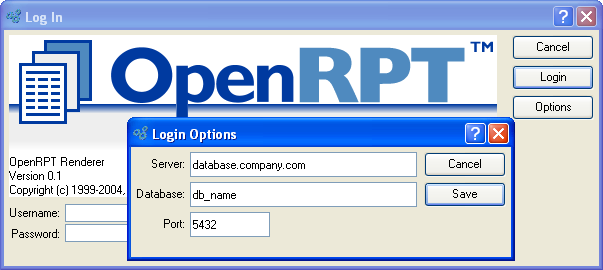
As you can see, the server and database information has yet to be specified. To specify connection details, select the OPTIONS button. The following screen will appear:
Note
The report renderer is designed to connect to PostgreSQL databases. However, the application’s source code could be modified to enable connections to other databases, as well.
When specifying database connection details, you are presented with the following options:
- Server
Enter the host name for the server you want to connect to.
- Database
Enter the name of the target database.
- Port
Enter the port number for the target database.
Once you have entered connection details, the server and database information will display on the initial log in screen, as shown below:
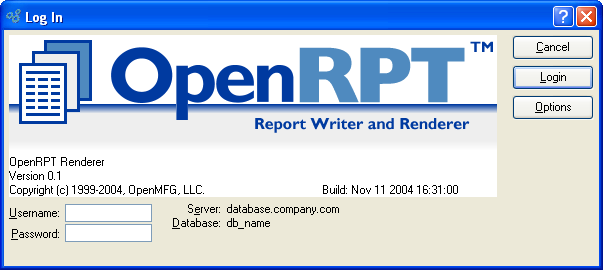
Finally, we enter username and password information, then select the LOGIN button. Once authentication is complete, the report renderer’s main application screen will appear, as shown below:
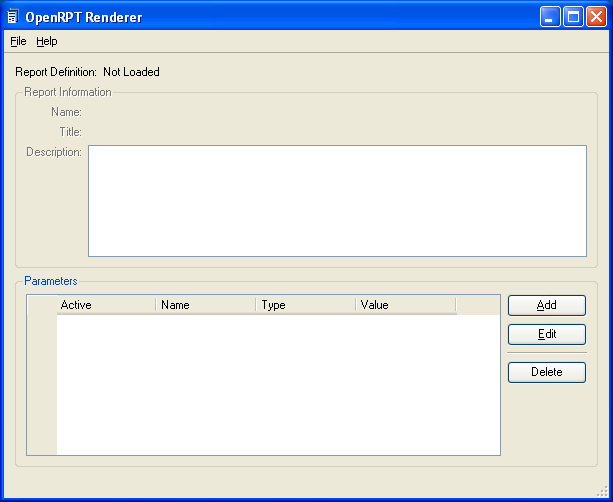
As you can see, no report definition has been loaded yet. Once a report definition is loaded—and parameters defined, if necessary—we can run the report and print the results.
In the next section, we will look at a sample report definition—and later we will load this sample into the report renderer.
As we have said, the report renderer can be used to generate miscellaneous reports using data stored within PostgreSQL databases. The report renderer’s miscellaneous or “ad hoc” reporting capability also extends to xTuple databases, which run on PostgreSQL. For xTuple users, this means you can use the report renderer to generate your own reports—thereby extending your reporting capability beyond the range of standard reports included with the xTuple application.
Tip
The report renderer enables xTuple users to extend their reporting capabilities. Use the report renderer to generate ad hoc, or custom xTuple reports.
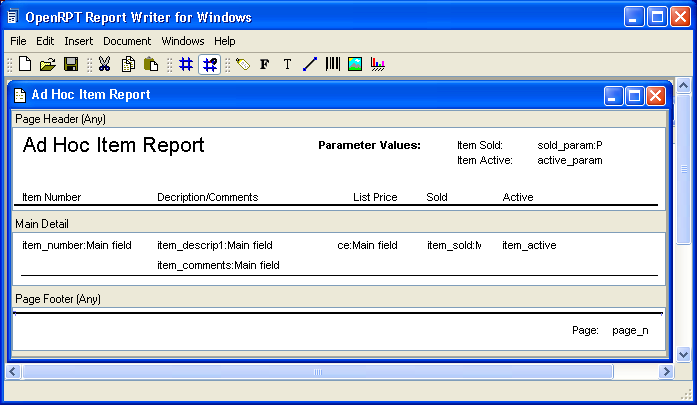
Before we can demonstrate report renderer functionality, we must first identify a report definition to work with. For this exercise, we created a simple report definition designed to retrieve basic Item information from an xTuple database. As the following screenshot shows, we created the report “AdHocItemReport” using the standalone OpenRPT application:
Note
xTuple users can create report definitions using either the embedded report writer or the standalone OpenRPT application. The report renderer then uses these report definitions to generate printed reports.
As you can tell from the figure, this simple “AdHocItemReport” will list Items and report on whether they are sold or active. The “AdHocItemReport” report is not one of the standard xTuple reports available in the application’s menu structure. However, we can retrieve this data and generate an ad hoc report when we combine this report definition with the standalone report renderer.
The next screenshot shows the query source the report definition will use to retrieve the data from our database:
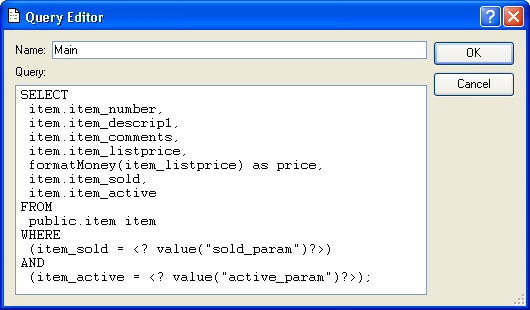
As you can see in the query source, the SELECT statement retrieves basic Item information from the item table. Then, MetaSQL is used in the WHERE clause to introduce two parameters: sold_param and active_param. The parameters refer to the report must interpret to accommodate two dynamic parameters. These parameters will enable the namely, whether application users have marked the Item as sold and/or active.
Note
The report displays whether or not an Item is sold and whether it is active. In the next section we see the query source and corresponding SQL query that retrieves the data from the database. As part of the SQL we will assign parameters that, when we generate the report with the Renderer, filter data based on user provided values for these two parameters.
Later, using OpenRPT, we will pass runtime parameter values to the report definition when we generate its output and in this way control the nature of the data displayed on the resulting report.
Tip
To accelerate the creation of any report definition, use the MetaSQL Editor to verify the accuracy of your SQL queries. Once queries have been validated, you can then copy and paste them into your report definition’s query source.
In this section we will look at a simple ad hoc report definition against the xTuple item table. Keep in mind that you are not restricted to xTuple databases and tables when using OpenRPT in conjunction with the OpenRPT Renderer. After reviewing a few key aspects of the report definition we will look at how to generate the report’s output with the OpenRPT Renderer.
This first step when using the OpenRPT Renderer is opening a report definition. Remember, these definitions are created using OpenRPT and are saved in XML format.
Tip
XML report definitions may be saved to a network drive. In this way many users can have access to a collection of Ad Hoc reports.
To open an XML report definition file:
Pull down the OpenRPT Renderer File menu
Select the option Open
In the Operating System’s open file dialogue, locate the report definition’s XML file and select it
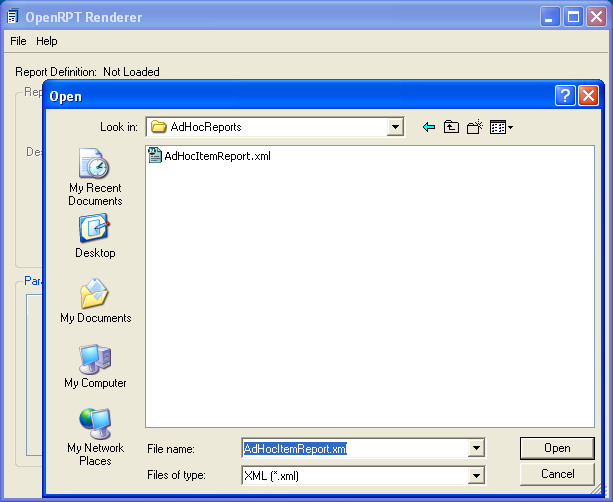
Locating Report Definition to Load into Renderer
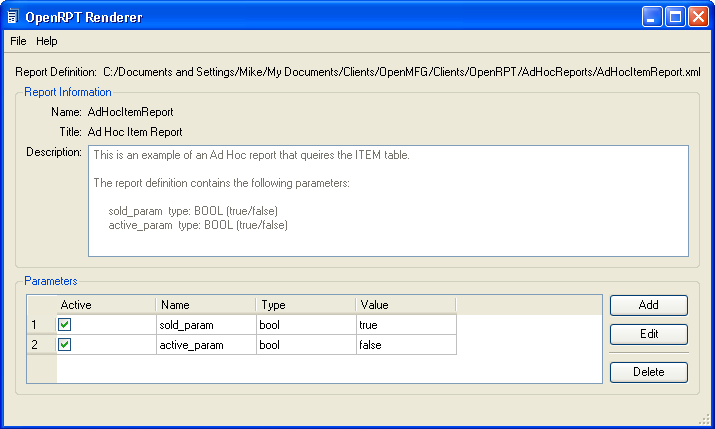
The following screenshot shows the renderer after the report definition has been loaded:
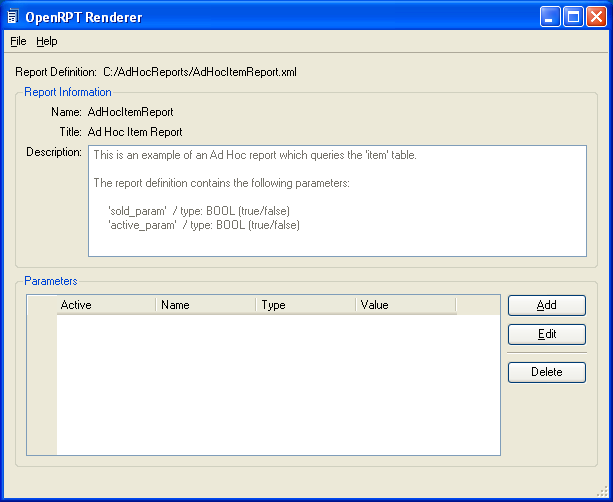
Report Definition Loaded
The top half of the OpenRPT Renderer contains a section called Report information. In it you will see the following information read from the report definition’s XML file:
Name
Title
Description
Developers of report definitions should utilize the Description section of a report definition to communicate information about what the report does to those who will use it.
You may recall that when we created our report definition’s SQL, we embedded in it (within the MetaSQL tags ‘<?’ and ‘?>’ parameters that will accept user defined values at run time. After we open an OpenRPT report definition, we must define these parameters and set their values before generating the report. The report definition we defined contains two parameters:
sold_paramactive_param
Let’s look at how a parameter is defined and a value assigned.
After opening the report definition click the ADD button. You will see the New Variant screen:
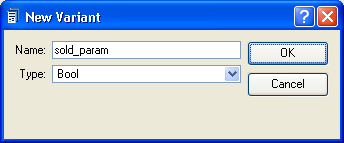
New Variant Screen
You must enter the exact Name of the parameter, as defined in the report definition, and assign it a Type. Above we see the sold_param defined as a Type “Bool” (Boolean) which means it has a True/False value in the database.
After clicking the OK button, you will be prompted to enter a value for the parameter and check whether or not it is Active.
Below we see the screen that enables us to set a value for the parameter we just define. This screen displays after we click the OK button on the New Variant screen.
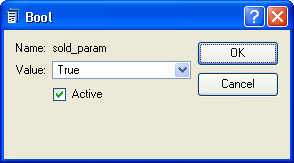
Setting Variant Values
Note that because the parameter was defined as type Bool, we are presented only with the options True of False for the parameter’s value.
It is important to set the parameter as Active if you want its value passed to the report definition at report run time.
Clicking the OK button returns you to the main screen for the OpenRPT Renderer and displays information about the parameter(s) in the Parameters section of the screen
Parameters values may changed by clicking the EDIT button found on the main OpenRPT Rendered screen. The user first selects a parameter to edit by clicking on it and then clicks the EDIT button. The OpenRPT Renderer displays the screen that enables the user to change the parameter’s value or uncheck the Active option to deactivate the parameter.
Parameters may be deleted with the DELETE button found on the main OpenRPT Renderer screen. The user first selects a parameter to delete by clicking on it and then clicks the DELETE button. The OpenRPT Renderer removes the parameter from the list of parameters displayed.
Note
Currently parameters are not saved. When the Renderer is closed, all parameter settings are lost and must be re-entered the next time the report definition is opened with the OpenRPT Renderer.
Now that you have:
Connected to the database
Opened report definition’s XML file
Defined parameters and set their values
It is possible to render the report’s output. Simply:
Pull down the File menu on the main OpenRPT Renderer screen
Select the Print option
Choose a printer and start the print job
Below we see our Ad Hoc Item Report:
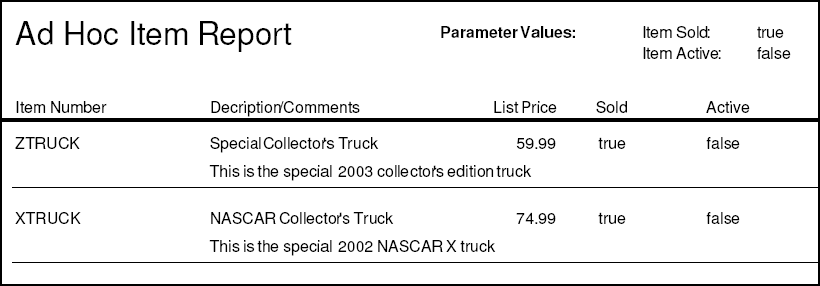
Above we see that the user, prior to running this report, set parameters that show only Items that are sold (sold_param = true) and that have been set to inactive status (active_param = false). The user could return to the OpenRPT Renderer and change one or both of the parameter’s values to generate a different report.
Tip
Utilities exist on the three support client platforms that enable the generation of printed output to a PDF formatted file (as seen above) for viewing on-screen.