
|
OpenRPT Product Guide |
|
|
OpenRPT Product Guide |
| 6.3.4. Graph Editor Series Tab | ||
|---|---|---|
 | 6.3. Defining the Graphing Object |  |
The tab in the Graph Editor enables you to define one or more series that are plotted on your graph.
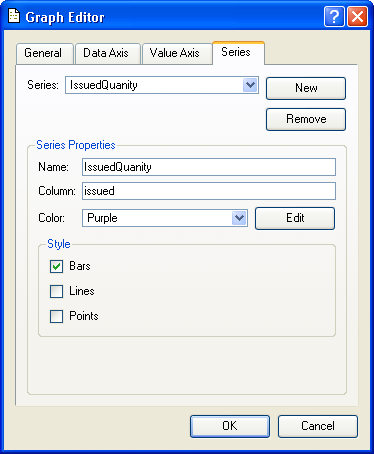
To establish a series click the button and then fill in the following:
Assign your new series a descriptive name. This name is for internal reference only and is not displayed on the graph.
Link your series to a column in the query source (linked to the graph under the tab) that contains the information you want graphed.
Select from the drop down list a color that you defined earlier. You may also click the button and define one or more new colors.
Check one or more styles to define how the data will display in the graph:
Displays the series in bar format, or stacked bars for multiple series defined as bars.
Displays the series in line format.
Displays the series as a point on the graph.
If you want to continue by adding another series, click the button. The series you are defining is saved and all values cleared so you can defined the new series' properties.
If you are done entering series information, you may click the button to exit the Graph Editor, or click on another tab under it.
This completes the mechanics for defining a graph in the report writer. Earlier in this section we saw the output of a report with an embedded graph. The definition process was easy and straight forward. The graphing capability enables you to quickly enhance existing reports or define new reports that improve how complex information is presented to users.
| |  | |
| 6.3.3. Graph Editor Value Tab |  | Chapter 4. OpenRPT and ODBC |