
|
OpenRPT Product Guide |
|
|
OpenRPT Product Guide |
| 6.3.2. Graph Editor Data Axis Tab | ||
|---|---|---|
 | 6.3. Defining the Graphing Object |  |
The tab in the Graph Editor defines your graph's X axis.
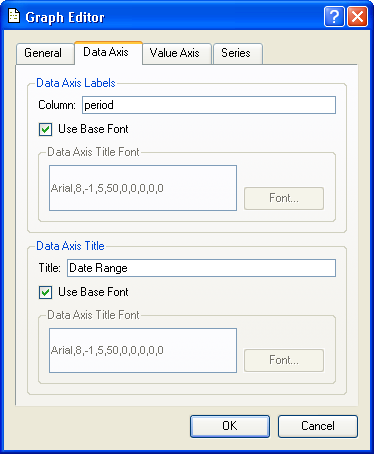
You may define the following information in the tab:
The Column field in this section refers to columns that are the query source you referenced under the tab. This column contains the dynamic data you want displayed along the bottom of the X axis. In our example, the column period contains the date for each period that will be displayed in our time-series graph of inventory activity.
This section enables you to provide a static description for the X axis that displays along its base.
Both sections under the tab enable you to select the base font defined under the tab, or, leave the option unchecked and use the button to specify a different font and size.
Now that the X axis is defined, it is time to define the static information and other parameters that control the Y axis.
| |  | |
| 6.3.1. Graph Editor General Tab |  | 6.3.3. Graph Editor Value Tab |