In this section, we will explore the various options found on the report writer's toolbar. The toolbar options are the same regardless of whether you’re running the embedded xTuple report writer or OpenRPT. For now, we will focus only on the toolbar functionality. In subsequent chapters, we will explain how to modify existing reports and also how to create new reports.
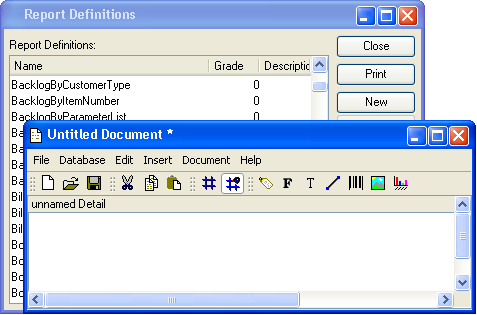
To see the toolbar using the xTuple report writer, we must first open a report definition. The term “report definition” refers to the files created by the report writer. Page layout, database queries, and so on are all parts of a report definition. For this exercise, we’ll open a new report by selecting the NEW button from the report definitions master list. The following screen will appear:
Note
All the functionality accessible using the toolbar options is also available from the drop-down menus.
For the remainder of this section, we will examine each of the options on the report writer toolbar. The following screenshot shows a close-up view of the toolbar:

As we look at the functionality related to each toolbar option, we will be moving from left to right—beginning with the New File option.

Clicking the “New File” option opens a new instance of the report writer. Select this option to create a new report definition. We will discuss creating new report definitions in the Advanced Topics chapter.

Use the “Open File” option to open a report definition stored on your local or network drive. Reports may be stored on local or network drives for backup or editing purposes. If you want to open a report stored in your xTuple Database, use the EDIT button found on the report definitions master list. For details on editing existing reports, see the Getting Started chapter.
The “Save File” option enables you to save report definitions to your local or network drive, where they may be stored for backup or editing purposes. This option will not save report definitions to a database. To learn more about saving reports to a database, see the Section 4.4, “Saving to a Database” section. Report definitions are saved using the Extensible Markup Language (XML) format.

The “Cut” option enables you to click on an object in a report definition, remove it, and then, using the “Paste” option, insert it to another part of the report.

The “Copy” option enables you to click on an object in a report, copy it (leaving the original in place), and then, using the “Paste” option, insert it into another part of the report.

The “Paste” option enables you to insert into the report definition an object that has been cut or copied using the “Cut” option or the “Copy” option.

The “Show Grid” option enables you to turn grid lines on for visual reference when aligning objects in a report definition. This option is a toggle, meaning grid lines may be turned on or off using this option.
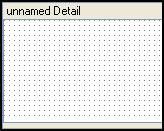
Clicking the “Show Grid” option turns grid lines on. The following screenshot shows a report definition with grid lines turned on:
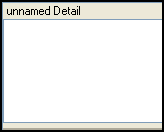
Clicking the “Show Grid” option a second time turns grid lines off, as shown in the following screenshot:
If you want to change the properties of your grid lines, the report writer gives you the ability to do so. To change your grid line settings, select the “Preferences” option from the Edit menu. The following screen will appear:
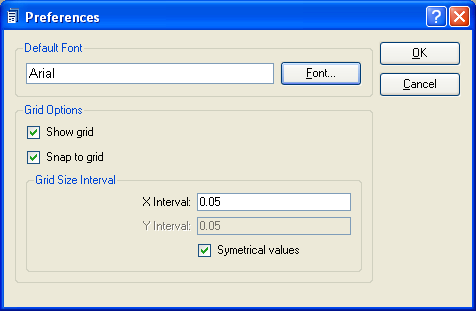
When establishing your report definition preferences, you are presented with the following options:
- Default Font
Select the default font to be used in the report definition by clicking on the FONT button located to the right of the field. Selecting the FONT button will bring up the “Select Font” screen, where you may specify font name, font style, font size, and font effects. Even though a default font is specified, you may override the default font on an object-by-object basis.
- Grid Options
Indicate your grid line settings, using the following parameters:
- Show grid
Selecting this option turns grid lines on. If this option is not selected, grid lines will be turned off. The “Show Grid” option accomplishes the same result.
- Snap to grid
Selecting this option aligns objects to the grid. If this option is not selected, grid lines will not be aligned to the grid. The “Snap to Grid” option accomplishes the same results.
- Grid Size Interval
Specify the distance (measured in inches) between the points of your grid lines, using the following parameters:
- X Interval
Enter an interval for the horizontal axis of your grid, measured in inches.
- Y Interval
Enter an interval for the vertical axis of your grid, measured in inches.
- Symmetrical values
Select if you want the X axis and the Y axis to use the same interval between points. If selected, you will not be able to enter an interval for the Y axis.
To the far right of the screen, the following buttons are available:
- OK
Select to save your settings.
- CANCEL
Closes the screen without saving any changes, returning you to the application desktop.

The “Snap to Grid” option forces objects to align to the grid when grid lines are turned on. This option is a toggle, meaning snap to grid functionality may be turned on or off using this option.

The “Label” option enables you to create new Label objects. Label objects are used to display descriptive information on a report definition, such as titles, headings, etc.
To create a new Label object, first select the "Label" option. Then click in the section of the report definition where you want the Label to be located. Doing so will create the Label object in that section.
Note
For more information on using Label objects in report definitions, see the Getting Started chapter.
Once the Label object has been created, you may then define the Label object’s properties. To define a Label object’s properties, double-click on the Label object. The following screen will appear:
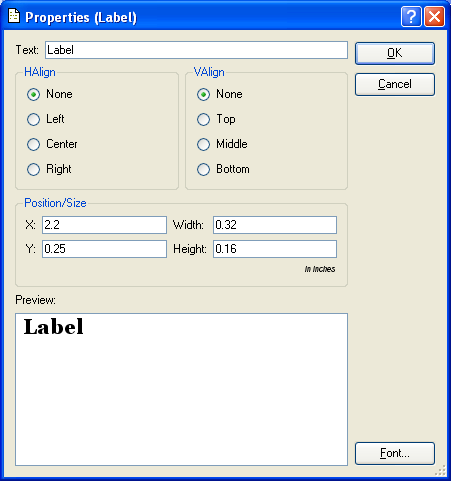
When defining the properties of a Label object, you are presented with the following options:
- Text
Enter the text of the Label. Text entered here will display in the “Preview” section of the screen.
- HAlign
Specify how you want text to be aligned horizontally within the Label object:
- None
Select if you do not want to specify a horizontal alignment.
- Left
Select to align text on the left margin.
- Center
Select to align text in the center.
- Right
Select to align text on the right margin.
- VAlign
Specify how you want text to be aligned vertically within the Label object:
- None
Select if you do not want to specify a vertical alignment.
- Top
Select to align text on the top margin.
- Middle
Select to align text in the middle.
- Bottom
Select to align text on the bottom margin.
- Position/Size
Specify how you want the Label object to be positioned and sized within the section where it is located.
- X
Specify the distance, measured in inches, from the section’s left border to the upper-left-hand corner of the Label object.
- Width
Specify the width of the Label object, measured in inches.
- Y
Specify the distance, measured in inches, from the section’s top border to the upper-left-hand corner of the Label object.
- Height
Specify the height of the Label object, measured in inches.
Tip
The position and size of a Label object may be modified manually when editing a report definition.
- Preview
Displays a preview of the Label text, using the specified font. Selecting the FONT button will bring up the “Select Font” screen, where you may specify font name, font style, font size, and font effects.
To the far right of the screen, the following buttons are available:
- OK
Select to save your settings.
- CANCEL
Closes the screen without saving any changes, returning you to the application desktop.

The “Field” option enables you to create new Field objects. Field objects are used for pulling dynamically generated data into a report from the database the report writer is connected to. For example, a Field object may be used to include running totals in a report. By definition, Field objects are designed to handle a single line of data. For multiple lines of data, use a Text Area object.
To create a new Field object, first select the "Field" option. Then click in the section of the report definition where you want the Field to be located. Doing so will create the Field object in that section.
Note
For more information on using Field objects in report definitions, see the Getting Started chapter.
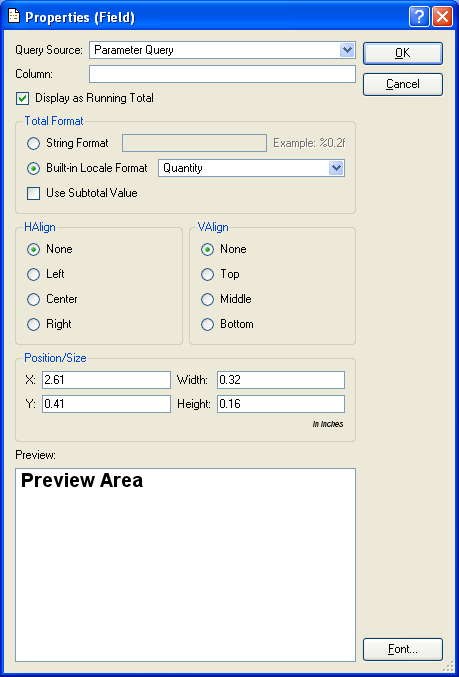
Once the Field object has been created, you may then define the Field object’s properties. To define a Field object’s properties, double-click on the Field object. The following screen will appear:
Note
By definition, Field objects are designed to handle a single line of data. For multiple lines of data, use a Text Area object.
When defining the properties of a Field object, you are presented with the following options:
- Query Source
Select a query source from the drop-down menu by clicking on the arrow to the right of the field. Query sources are used to populate report definition objects with dynamic data from the database the report writer is connected to.
- Column
Specify the name of the database column you want to use from the selected query source. A query source may refer to multiple columns in its
SELECTstatement. By indicating a specific column, you instruct the query source to return data only for that specified column. Other columns appearing in theSELECTstatement will be ignored.Note
For more information on query sources and the link between database fields and report definition objects, please see the Getting Started chapter.
- Display as Running Total
Select if you want the data retrieved from the database to be displayed as a running total. No running total will be used if this option is not selected.
Note
When running totals are calculated for columns designated as Boolean, the “true” values are assigned a value of “1,” while “false” values are assigned a value of “0.”
- Total Format
If the “Display as Running Total” option is selected, specify one of the following formatting options:
- String Format
Enter a string format to use when formatting the total.
- Built-in Locale Format
Select this option and then choose one of the available options from the drop-down menu by clicking on the arrow to the right of the field. Built-in Locale Formats may only be available in some installations.
- Use Subtotal Value
Select if the running total represents a subtotal.
- HAlign
Specify how you want text to be aligned horizontally within the Field object:
- None
Select if you do not want to specify a horizontal alignment.
- Left
Select to align text on the left margin.
- Center
Select to align text in the center.
- Right
Select to align text on the right margin.
- VAlign
Specify how you want text to be aligned vertically within the Field object:
- None
Select if you do not want to specify a vertical alignment.
- Top
Select to align text on the top margin.
- Middle
Select to align text in the middle.
- Bottom
Select to align text on the bottom margin.
- Position/Size
Specify how you want the Field object to be positioned and sized within the section where it is located.
- X
Specify the distance, measured in inches, from the section’s left border to the upper-left-hand corner of the Field object.
- Width
Specify the width of the Field object, measured in inches.
- Y
Specify the distance, measured in inches, from the section’s top border to the upper-left-hand corner of the Field object.
- Height
Specify the height of the Field object, measured in inches.
Tip
The position and size of a Field object may be modified manually when editing a report definition.
- Preview
Displays a preview of the Field, using the specified font. Selecting the FONT button will bring up the “Select Font” screen, where you may specify font name, font style, font size, and font effects.
To the far right of the screen, the following buttons are available:
- OK
Select to save your settings.
- CANCEL
Closes the screen without saving any changes, returning you to the application desktop.

The “Text Area” option enables you to create new Text Area objects. Text Area objects are used for pulling dynamically generated, multi-line data into a report from the database the report writer is connected to. By definition, Text Area objects are designed to handle multiple lines of data.
To create a new Text Area object, first select the "Text Area" option. Then click in the section of the report definition where you want the Text Area to be located. Doing so will create the Text Area object in that section.
Note
For more information on using Text Area objects in report definitions, see the Getting Started chapter.
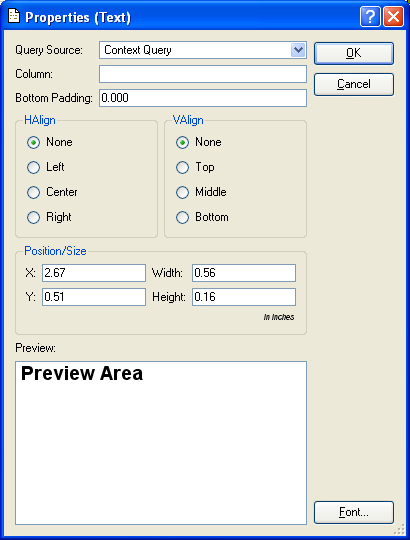
Once the Text Area object has been created, you may then define the Text Area object’s properties. To define a Text Area object’s properties, double-click on the Text Area object. The following screen will appear:
Note
By definition, Text Area objects are designed to handle multiple lines of data.
When defining the properties of a Text Area object, you are presented with the following options:
- Query Source
Select a query source from the drop-down menu by clicking on the arrow to the right of the field. Query sources are used to populate report definition objects with dynamic data from the database the report writer is connected to.
- Column
Specify the name of the database column you want to use from the selected query source. A query source may refer to multiple columns in its
SELECTstatement. By indicating a specific column, you instruct the query source to return data only for that specified column. Other columns appearing in theSELECTstatement will be ignored.Note
For more information on query sources and the link between database fields and report definition objects, please see the Getting Started chapter.
- Bottom Padding
Specify the minimum amount of space between the last line of text in the Text Area object and the end of the section where the Text Area object is located, measured in inches. The amount of space between the last line of text and the end of a section will always be equal to at least the bottom padding value.
- HAlign
Specify how you want text to be aligned horizontally within the Text Area object:
- None
Select if you do not want to specify a horizontal alignment.
- Left
Select to align text on the left margin.
- Center
Select to align text in the center.
- Right
Select to align text on the right margin.
- VAlign
Specify how you want text to be aligned vertically within the Text Area object:
- None
Select if you do not want to specify a vertical alignment.
- Top
Select to align text on the top margin.
- Middle
Select to align text in the middle.
- Bottom
Select to align text on the bottom margin.
- Position/Size
Specify how you want the Text Area object to be positioned and sized within the section where it is located.
- X
Specify the distance, measured in inches, from the section’s left border to the upper-left-hand corner of the Text Area object.
- Width
Specify the width of the Text Area object, measured in inches.
- Y
Specify the distance, measured in inches, from the section’s top border to the upper-left-hand corner of the Text Area object.
- Height
Specify the height of the Text Area object, measured in inches.
Tip
The position and size of a Text Area object may be modified manually when editing a report definition.
- Preview
Displays a preview of the Text Area object, using the specified font. Selecting the FONT button will bring up the “Select Font” screen, where you may specify font name, font style, font size, and font effects.
To the far right of the screen, the following buttons are available:
- OK
Select to save your settings.
- CANCEL
Closes the screen without saving any changes, returning you to the application desktop.

The “Line” option enables you to create new Line objects. Line objects are used for drawing vertical, horizontal, and diagonal lines.
To create a new Line object, first select the "Line" option. Then click in the section of the report definition where you want the Line to be located. Doing so will create the Line object in that section. Once the Line object has been created, click on the object and drag it with your mouse. As you will see, dragging the Line object draws the Line in any direction and to any length you wish.
Tip
If you hold down the SHIFT key on your keyboard when you are dragging a Line object, this will force the Line to straighten out. Also, once a Line has been inserted, you may change its orientation by clicking and dragging the whole Line or either one of its end points.
After you have inserted a Line object into a report definition, you may then define the width of the Line object. To define the width of a Line object, double-click on the Line object. The following screen will appear:
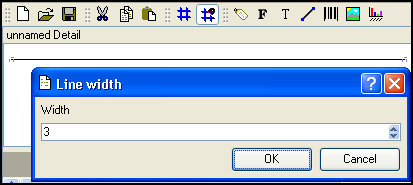
When defining the width of a Line object, you are presented with the following options:
- Width
Specify the width of the Line, measured in pixels, by entering a number either manually or by using the arrows to the right of the field. The maximum Line width is 100 pixels.
At the bottom of the screen, the following buttons are available:
- OK
Select to save your settings.
- CANCEL
Closes the screen without saving any changes, returning you to the application desktop.

The “Bar Code” option enables you to create new bar code objects. Bar code objects are used to represent dynamic information stored in a database in bar code format.
To create a new bar code object, first select the "Bar Code" option. Then click in the section of the report definition where you want the bar code to be located. Doing so will create the bar code object in that section.
Note
For more information on using bar code objects in report definitions, see the Getting Started and Advanced Topics chapters.
Once the bar code object has been created, you may then define the bar code object’s properties. To define a bar code object’s properties, double-click on the bar code object. The following screen will appear:
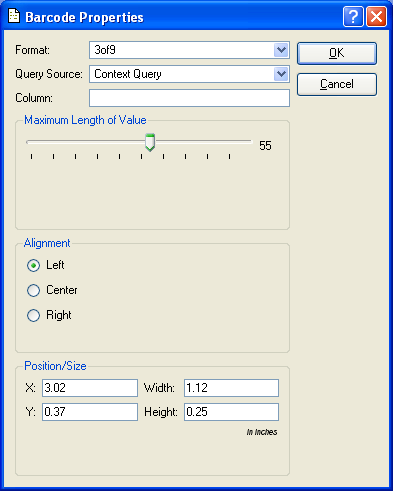
When defining the properties of a bar code object, you are presented with the following options:
- Format
Select one of the bar code formatting options from the drop-down menu by clicking on the arrow to the right of the field. The report writer supports the following bar code formats:
3of9
3of9+
128
ean13
ean8
upc-a
upc-e
- Query Source
Select a query source from the drop-down menu by clicking on the arrow to the right of the field. Query sources are used to populate report definition objects with dynamic data from the database the report writer is connected to.
- Column
Specify the name of the database column you want to use from the selected query source. A query source may refer to multiple columns in its
SELECTstatement. By indicating a specific column, you instruct the query source to return data only for that specified column. Other columns appearing in theSELECTstatement will be ignored.Note
For more information on query sources and the link between database fields and report definition objects, please see the Getting Started chapter.
- Maximum Length of Value
Specify the maximum number of characters you expect your bar code data to contain. The length of the bar code will not exceed the value entered here. If fewer characters than the maximum number are used, the bar code will be aligned within the bar code object based on the alignment specified below.
- Alignment
Specify how you want the bar code to be aligned horizontally if its length is fewer characters than the maximum length specified above:
- Left
Select to align the bar code on the left margin of the bar code object.
- Center
Select to align the bar code in the center of the bar code object.
- Right
Select to align the bar code on the right margin of the bar code object.
Note
Bar codes always fill the entire vertical space specified for a bar code object. As a result, no vertical alignment is required.
- Position/Size
Specify how you want the bar code object to be positioned and sized within the section where it is located.
- X
Specify the distance, measured in inches, from the section’s left border to the upper-left-hand corner of the bar code object.
- Width
Specify the width of the bar code object, measured in inches.
- Y
Specify the distance, measured in inches, from the section’s top border to the upper-left-hand corner of the bar code object.
- Height
Specify the height of the bar code object, measured in inches.
To the far right of the screen, the following buttons are available:
- OK
Select to save your settings.
- CANCEL
Closes the screen without saving any changes, returning you to the application desktop.

The “Image” option enables you to create new Image objects. Image objects are used to insert either static or dynamic Images into a report definition. Static Images—a company logo displayed in the Report Header, for example—are embedded within the report definition. Dynamic Images—pictures of products, for example—are pulled from the database the report writer is connected to.
To create a new Image object, first select the "Image" option. Then click in the section of the report definition where you want the Image to be located. Doing so will create the Image object in that section.
Note
For more information on using Image objects in report definitions, see the Advanced Topics chapter.
Once the Image object has been created, you may then edit the Image object’s properties. To edit an Image object’s properties, double-click on the Image object. The following screen will appear:
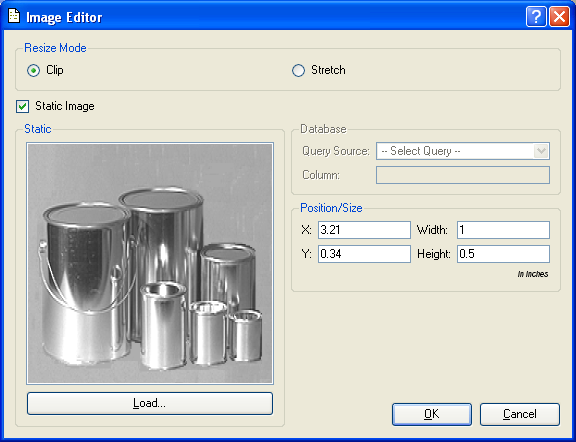
When editing the properties of an Image object, you are presented with the following options:
- Resize Mode
Specify one of the following resizing preferences:
- Clip
Select to have the Image imported as-is into the Image object. If selected, no resizing of the Image will occur.
- Stretch
Select to enable manual resizing of the Image once it has been imported into the Image object. When manually resizing an Image, the Image’s aspect ratio will be maintained.
- Static Image
Select if the Image you are importing is a static Image. Static Images are Images which are embedded within a report definition. They are not pulled dynamically from a database. An example of a static Image would be a company logo inserted on the top of a standard Form.
- Database
Specify the following information if the Image you are importing will be pulled dynamically from a database the report writer is connect to:
- Query Source
Select a query source from the drop-down menu by clicking on the arrow to the right of the field. Query sources are used to populate report definition objects with dynamic data from the database the report writer is connected to.
Note
For more information on query sources and the link between database fields and report definition objects, please see the Getting Started chapter.
- Column
Specify the name of the database column you want to use from the selected query source. A query source may refer to multiple columns in its
SELECTstatement. By indicating a specific column, you instruct the query source to return data only for that specified column. Other columns appearing in theSELECTstatement will be ignored.Note
xTuple users can store Images in an xTuple Database using the client interface. Images imported this way are stored in the
image_datacolumn of theimagestable, using the UU encoding format.- Position/Size
Specify how you want the Image object to be positioned and sized within the section where it is located.
- X
Specify the distance, measured in inches, from the section’s left border to the upper-left-hand corner of the Image object.
- Width
Specify the width of the Image object, measured in inches.
- Y
Specify the distance, measured in inches, from the section’s top border to the upper-left-hand corner of the Image object.
- Height
Specify the height of the Image object, measured in inches.
Note
The position and size of an Image object may be modified manually when editing a report definition.
At the bottom of the screen, the following buttons are available:
- OK
Select to save your settings.
- CANCEL
Closes the screen without saving any changes, returning you to the application desktop.

The “Graph” option enables you to create new Graph objects. Graph objects are used to insert Graphs into a report definition using dynamic data stored in a database the report writer is connected to.
To create a new Graph object, first select the "Graph" option. Then click in the section of the report definition where you want the Graph to be located. Doing so will create the Graph object in that section.
Note
For more information on using Graph objects in report definitions, see the Advanced Topics chapter.
Once the Graph object has been created, you may then edit the Graph object’s properties. To edit a Graph object’s properties, double-click on the Graph object. The following screen will appear:
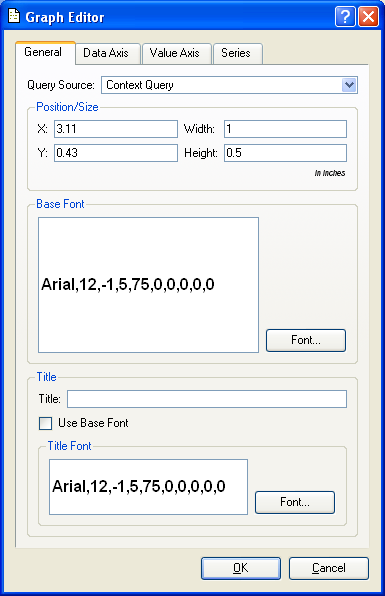
When editing the general properties of a Graph object, you are presented with the following options:
- Query Source
Select a query source from the drop-down menu by clicking on the arrow to the right of the field. Query sources are used to populate report definition objects with dynamic data from the database the report writer is connected to.
Note
For more information on query sources and the link between database fields and report definition objects, please see the Getting Started chapter.
- Position/Size
Specify how you want the Image object to be positioned and sized within the section where it is located.
- X
Specify the distance, measured in inches, from the section’s left border to the upper-left-hand corner of the Image object.
- Width
Specify the width of the Image object, measured in inches.
- Y
Specify the distance, measured in inches, from the section’s top border to the upper-left-hand corner of the Image object.
- Height
Specify the height of the Image object, measured in inches.
Tip
The position and size of a Graphic object may be modified manually when editing a report definition.
- Base Font
Select the base font to be used in the Graph object by clicking on the FONT button located to the right of the field. Selecting the FONT button will bring up the “Select Font” screen, where you may specify font name, font style, font size, and font effects. The base font may be used throughout the Graph object.
- Title
Specify the following details for the Graph object’s title:
- Title
Enter the title you want to appear centered at the top of the Graph.
- Use Base Font
Select to use the specified base font. If not selected, the title font will be used.
- Title Font
Specify the font to be used for the Graph object’s title by clicking on the FONT button located to the right of the field. Selecting the FONT button will bring up the “Select Font” screen, where you may specify font name, font style, font size, and font effects.
At the bottom of the screen, the following buttons are available:
- OK
Select to save your settings.
- CANCEL
Closes the screen without saving any changes, returning you to the application desktop.
To define the properties of the Graph object’s data axis—that is, the horizontal axis running along the bottom of the Graph—select the “Data Axis” tab at the top of the “Graph Editor” screen. The following screen will appear:
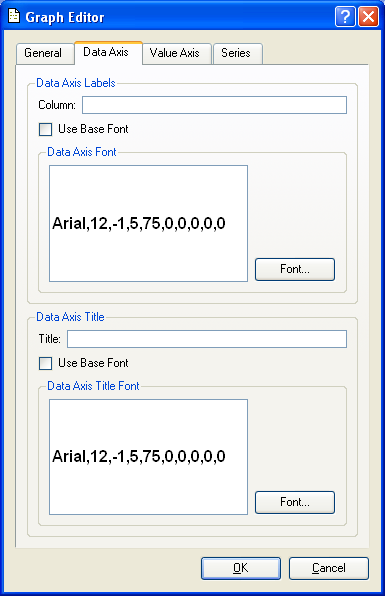
When editing the data axis properties of a Graph object, you are presented with the following options:
- Data Axis Labels
Specify the following details for the data axis labels:
- Column
Specify the name of the database column you want to use from the selected query source. A query source may refer to multiple columns in its
SELECTstatement. By indicating a specific column, you instruct the query source to return data only for that specified column. Other columns appearing in theSELECTstatement will be ignored.Note
The term “data axis labels” refers to the identifying information which describes each of the items in a Graph’s series. For example, if a Graph displays information about a series of Item Numbers, then data axis labels would be used to identify each of the Items in the series.
- Use Base Font
Select to use the specified base font. If not selected, the data axis font will be used.
- Data Axis Font
Specify the font to be used for the data axis labels by clicking on the FONT button located to the right of the field. Selecting the FONT button will bring up the “Select Font” screen, where you may specify font name, font style, font size, and font effects.
- Data Axis Title
Specify the following details for the data axis title:
- Title
Enter the title you want to appear centered along the bottom of the Graph’s data axis.
- Use Base Font
Select to use the specified base font. If not selected, the data axis title font will be used.
- Data Axis Title Font
Specify the font to be used for the data axis title by clicking on the FONT button located to the right of the field. Selecting the FONT button will bring up the “Select Font” screen, where you may specify font name, font style, font size, and font effects.
At the bottom of the screen, the following buttons are available:
- OK
Select to save your settings.
- CANCEL
Closes the screen without saving any changes, returning you to the application desktop.
To define the properties of the Graph object’s value axis—that is, the vertical axis running along the left-hand side of the Graph—select the “Value Axis” tab at the top of the “Graph Editor” screen. The following screen will appear:
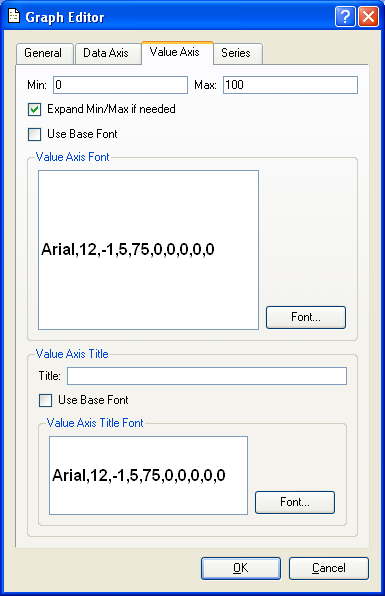
When editing the value axis properties of a Graph object, you are presented with the following options:
- Min
Specify the minimum value you want to have appear on the Graph object’s value axis.
- Max
Specify the maximum value you want to have appear on the Graph object’s value axis.
- Expand Min/Max if needed
Select to allow data represented in the Graph to expand beyond the minimum and maximum values specified if needed. If not selected, data will be restricted to the limits specified for the minimum and maximum values.
- Use Base Font
Select to use the specified base font. If not selected, the value axis font will be used.
- Value Axis Font
Specify the font to be used for values in the value axis by clicking on the FONT button located to the right of the field. Selecting the FONT button will bring up the “Select Font” screen, where you may specify font name, font style, font size, and font effects.
- Value Axis Title
Specify the following details for the value axis title:
- Title
Enter the title you want to appear centered along the left-hand margin of the Graph’s value axis.
- Use Base Font
Select to use the specified base font. If not selected, the value axis title font will be used.
- Value Axis Title Font
Specify the font to be used for the value axis title by clicking on the FONT button located to the right of the field. Selecting the FONT button will bring up the “Select Font” screen, where you may specify font name, font style, font size, and font effects.
At the bottom of the screen, the following buttons are available:
- OK
Select to save your settings.
- CANCEL
Closes the screen without saving any changes, returning you to the application desktop.
To define the properties of Graph object series, select the “Series” tab at the top of the “Graph Editor” screen. The following screen will appear:
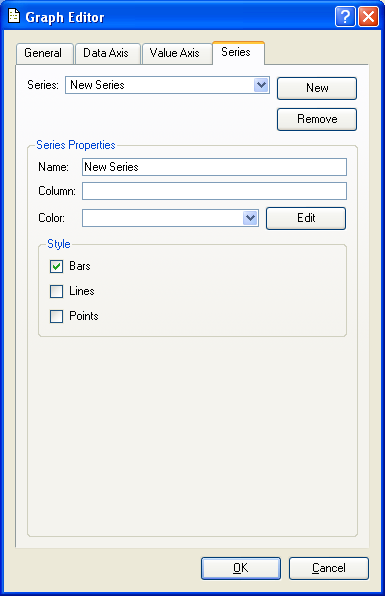
When editing the properties of a Graph object series, you are presented with the following options:
- Series
Select a series from the drop-down menu by clicking on the arrow to the right of the field. Each Graph must contain at least one series—and may contain multiple series. Using multiple series enables you to compare and contrast information from different database columns within a single Graph. To create a new series, select the NEW button. By default, a new series will be given the name “New Series.” You may edit this default name within the “Name” field below. To remove a series from the list of series, select the REMOVE button.
Note
You may assign different properties to each series in a graph (e.g., different colors) to make a clear visual distinction between series.
- Series Properties
Specify properties for the selected series using the following options:
- Name
Displays the name of the series. You may edit the name of the series using this field. Any editing changes will be saved automatically.
- Column
Specify the name of the database column you want to use from the selected query source. A query source may refer to multiple columns in its
SELECTstatement. By indicating a specific column, you instruct the query source to return data only for that specified column. Other columns appearing in theSELECTstatement will be ignored.- Color
Specify the color you want to use to represent data in the series. Selecting the EDIT button will bring up several color definition screens. You have the ability to specify multiple colors, using either the included color wheel or standard RGB values.
- Style
Specify one of the following options to be used for representing items in the series: “Bars,” “Lines,” or “Points.”
At the bottom of the screen, the following buttons are available:
- OK
Select to save your settings.
- CANCEL
Closes the screen without saving any changes, returning you to the application desktop.